AQI.in Explained: How to Check Live Air Quality in India (2026)
Learn how AQI.in works, understand India's AQI scale, compare private air quality readings with CPCB data, and interpret PM2.5 levels.
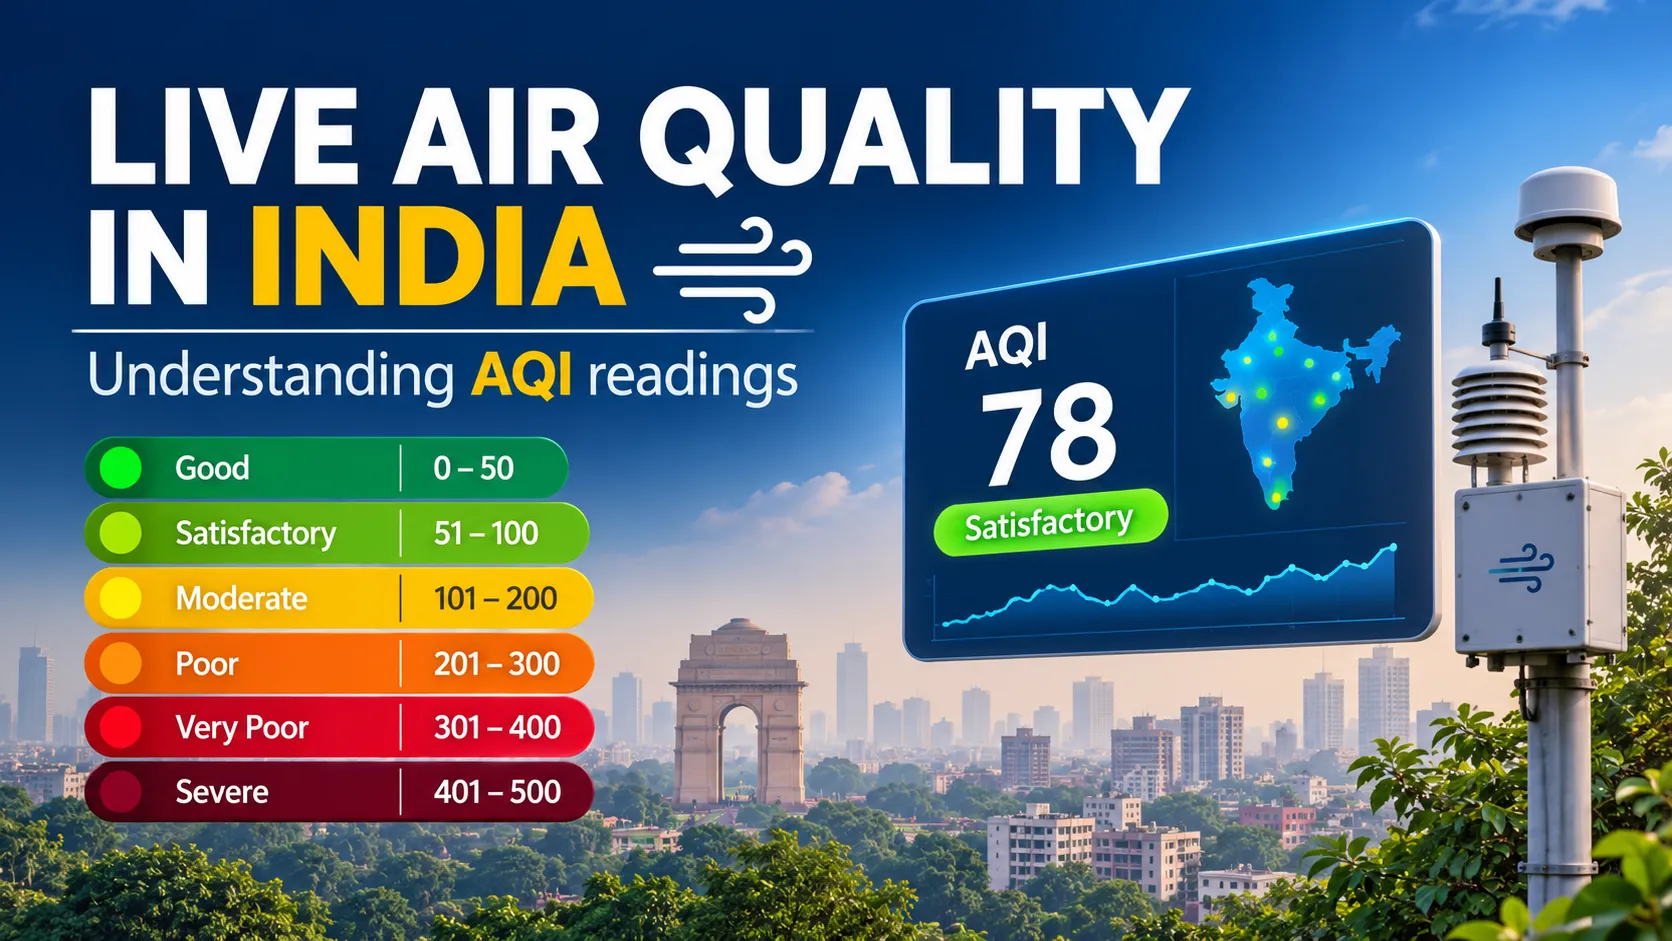
AQI.in explained: how to check live air quality in India and read the numbers
Delhi’s air crossed the 300 mark on Monday, November 2, 2026, reaching 307 at 7:05 am on the CPCB’s real-time data. That put the capital in the “very poor” category, and 37 of its 58 stations were reading above 300. Every year around this time, millions of people open an air quality app before they open the window.
AQI.in is one of those apps. It shows live AQI, PM2.5, PM10, temperature, humidity, and noise readings from outdoor monitors across India.
Here’s how it works, who runs it, and one labeling quirk you should know about before you trust any single number.
What is AQI.in?
AQI.in is a real-time air quality platform for India. Its homepage promises live readings of AQI, PM2.5, PM10, temperature, humidity, and noise from outdoor monitors, searchable by city or neighborhood.
The site and app offer 6 things, according to the homepage:
- Air quality readings from the nearest monitor to your location
- Health advice that changes with the AQI level
- A breakdown of the pollutants behind the AQI number
- A pollution map for comparing locations
- A home screen widget
- A share feature that puts the live AQI on a photo for social media
YourStory reports that Prana Air, a New Delhi hardware company, operates AQI.in. That detail matters, and I’ll come back to it.
Who runs AQI.in, and does that matter?
Prana Air operates AQI.in, and it also sells air quality gear. YourStory says the company has built close to 20 products, from pocket PM2.5 monitors to N95 masks, priced between Rs 999 and Rs 1.77 lakh.
A company that sells monitors and masks has a business reason to publish air quality data. That’s a normal arrangement, and it doesn’t make the readings wrong. It does mean you should treat the platform as a private network and cross-check it against government sources.
The AQI.in homepage doesn’t explain how its sensors are calibrated, so I can’t tell you how closely they match regulatory monitors. YourStory says the platform follows the framework of India’s National Air Quality Index, set by the CPCB in 2014.
What do the AQI numbers mean in India?
India’s official AQI runs from 0 to 500 and has 6 categories. The Central Pollution Control Board (CPCB) set them in 2014, and the Tribune lists the bands used in this season’s coverage.
| AQI | CPCB category | PM2.5 (µg/m³, 24-hour) |
|---|---|---|
| 0 to 50 | Good | 0 to 30 |
| 51 to 100 | Satisfactory | 31 to 60 |
| 101 to 200 | Moderate | 61 to 90 |
| 201 to 300 | Poor | 91 to 120 |
| 301 to 400 | Very poor | 121 to 250 |
| 401 to 500 | Severe | Above 250 |
The PM2.5 column comes from the CPCB breakpoints as reproduced by Energy and Clean Air and other analysts.
How does the AQI get calculated?
The index uses 8 pollutants: PM2.5, PM10, NO₂, SO₂, CO, O₃, NH₃, and lead. According to the CPCB’s design document, the system turns that data into one number, one color, and one description.
The final AQI is the worst sub-index among the pollutants measured. In winter that’s usually PM2.5. The CPCB data for the National Capital Region shows PM2.5 as the prominent pollutant in Delhi, Gurugram, and Noida on a typical severe day.
Why do AQI.in’s labels differ from the CPCB’s?
AQI.in’s homepage uses the same number bands as the CPCB but different category names. That can change how an AQI of 350 sounds.
Here’s the comparison:
| AQI | AQI.in homepage label | CPCB label |
|---|---|---|
| 51 to 100 | Moderate | Satisfactory |
| 101 to 200 | Poor | Moderate |
| 201 to 300 | Unhealthy | Poor |
| 301 to 400 | Severe | Very poor |
| 401 to 500 | Hazardous | Severe |
So an AQI of 350 reads “Severe” on AQI.in’s page and “Very poor” on the CPCB’s scale. News reports quote the CPCB names, so you’ll see a mismatch if you compare the two.
The numbers decide your action. Check which label set an app uses before you compare it with a headline. If a bulletin says “severe,” ask whether it means 301 to 400 or 401 and above.
What should you do at each AQI level?
AQI.in’s homepage gives activity advice for each band. The advice follows a simple pattern: the higher the number, the less time outdoors and the less exertion.
- 0 to 50: normal activity is fine.
- 51 to 100: sensitive people, including those with asthma or heart and lung disease, should cut back on heavy outdoor exertion.
- 101 to 200: sensitive groups should take more breaks and move strenuous activity indoors.
- 201 to 300: everyone should reduce prolonged or heavy exertion outside.
- 301 to 400: do necessary outdoor tasks at the cleanest time of day, and wear a pollution mask.
- 401 to 500: stay indoors as much as possible and keep medicines handy.
The site recommends a pollution mask at the top two bands. For PM2.5, an N95-type respirator is the usual choice, because cloth and surgical masks filter fine particles poorly. If you have a heart or lung condition, ask your doctor for personal advice. This article isn’t medical guidance.
How accurate is a private sensor network?
A private network fills gaps, and it needs cross-checking. India’s official monitoring covers far fewer people than you’d expect.
Outlook Business reported in 2026 on the State of India’s Environment report. India has 562 real-time monitors across 294 cities, plus 966 manual stations in 419 cities and towns. Only 15% of Indians live near a real-time monitor, and over 64% of districts have no continuous monitoring.
That gap is why private and low-cost networks exist. A neighborhood sensor can show what a station 10 km away misses.
The tradeoff runs the other way too. Moneylife quotes experts saying reference-grade monitors are needed to verify that real-time stations work properly. A low-cost sensor without published calibration can drift. Compare readings from 2 or 3 sources before you act on a number that looks extreme.
What’s the difference between the official AQI and a live reading?
The official AQI averages pollution across a day or a large area, which can hide short spikes. Deccan Herald’s explainer says India’s national AQI averages over the day or across a wide area.
That’s why your neighborhood can feel worse than the city number. A road near a construction site or a burning pile can push local PM2.5 well above the citywide average.
A hyperlocal app helps here. Use the live number to decide if a run or a school trip is okay right now, and use the CPCB number to follow the official daily story.
How does India’s AQI compare with WHO guidelines?
India’s air quality standards are looser than WHO’s. Down To Earth’s comparison shows the gap for PM2.5.
| Standard | PM2.5 annual | PM2.5 24-hour |
|---|---|---|
| WHO 2021 guideline | 5 µg/m³ | 15 µg/m³ |
| India NAAQS (2009) | 40 µg/m³ | 60 µg/m³ |
India’s annual limit is 8 times the WHO guideline, and its 24-hour limit is 4 times higher. WHO released the revised guidelines on September 22, 2021, tightening the 2005 values of 10 and 25.
So a day labeled “satisfactory” in India (PM2.5 of 31 to 60) can still sit above WHO’s 24-hour guideline of 15. The category tells you about relative risk. It doesn’t tell you the air is safe by WHO’s measure.
How do you check air quality in 4 steps?
Use two sources and watch the trend. Here’s a routine that takes under a minute:
- Open AQI.in and look at the station nearest to you.
- Check the CPCB’s real-time portal or the SAMEER app for the official figure.
- Note the pollutant. PM2.5 days call for masks and closed windows, and ozone days call for a different plan.
- Look at the next few hours, and schedule outdoor activity for the cleanest window.
ETV Bharat quotes an official saying the SAMEER app is the authenticated source for Indian AQI readings, based on the CPCB’s guidelines.
Frequently asked questions
Is AQI.in accurate?
It shows readings from its own monitor network, and the homepage doesn’t publish calibration details. Compare it with CPCB data before you make a health decision.
Is AQI.in an official government source?
No. Prana Air, a private company, operates it. The government’s official source is the CPCB, with the SAMEER app for public access.
What is a good AQI in India?
An AQI from 0 to 50 is “good” on the CPCB scale. A PM2.5 level of 30 µg/m³ or less over 24 hours falls in that band.
Why does AQI.in call 301 to 400 “severe”?
Its homepage uses different names from the CPCB. The CPCB calls that band “very poor” and reserves “severe” for 401 to 500.
Is air quality worse in winter?
Delhi’s early-November numbers show it can be. The capital recorded its first “very poor” day of the season on November 2, 2026.
Key facts at a glance
- Site: aqi.in, operated by Prana Air per YourStory
- Data shown: AQI, PM2.5, PM10, temperature, humidity, and noise
- Official scale: CPCB’s 0 to 500 AQI with 6 categories, set in 2014
- Pollutants in the index: 8 (PM2.5, PM10, NO₂, SO₂, CO, O₃, NH₃, lead)
- Label mismatch: AQI.in calls 301 to 400 “severe,” while the CPCB calls it “very poor”
- WHO 2021 PM2.5 guideline: 5 µg/m³ annual, 15 µg/m³ for 24 hours
- India NAAQS PM2.5: 40 µg/m³ annual, 60 µg/m³ for 24 hours
- Monitoring gap: 562 real-time monitors in 294 cities, 15% of Indians covered
- Delhi, November 2, 2026: AQI of 307 at 7:05 am, per CPCB real-time data
- Best practice: compare AQI.in with CPCB or SAMEER before acting on an extreme number