ChatGPT Image Generation: 10 Visual Styles for Learning (With Exact Prompts)
Discover 10 powerful ChatGPT image generation styles for learning, including whiteboards, mind maps, cheat sheets, flowcharts, blueprints, and classroom notes. Includes exact prompts for GPT-4o educational images.
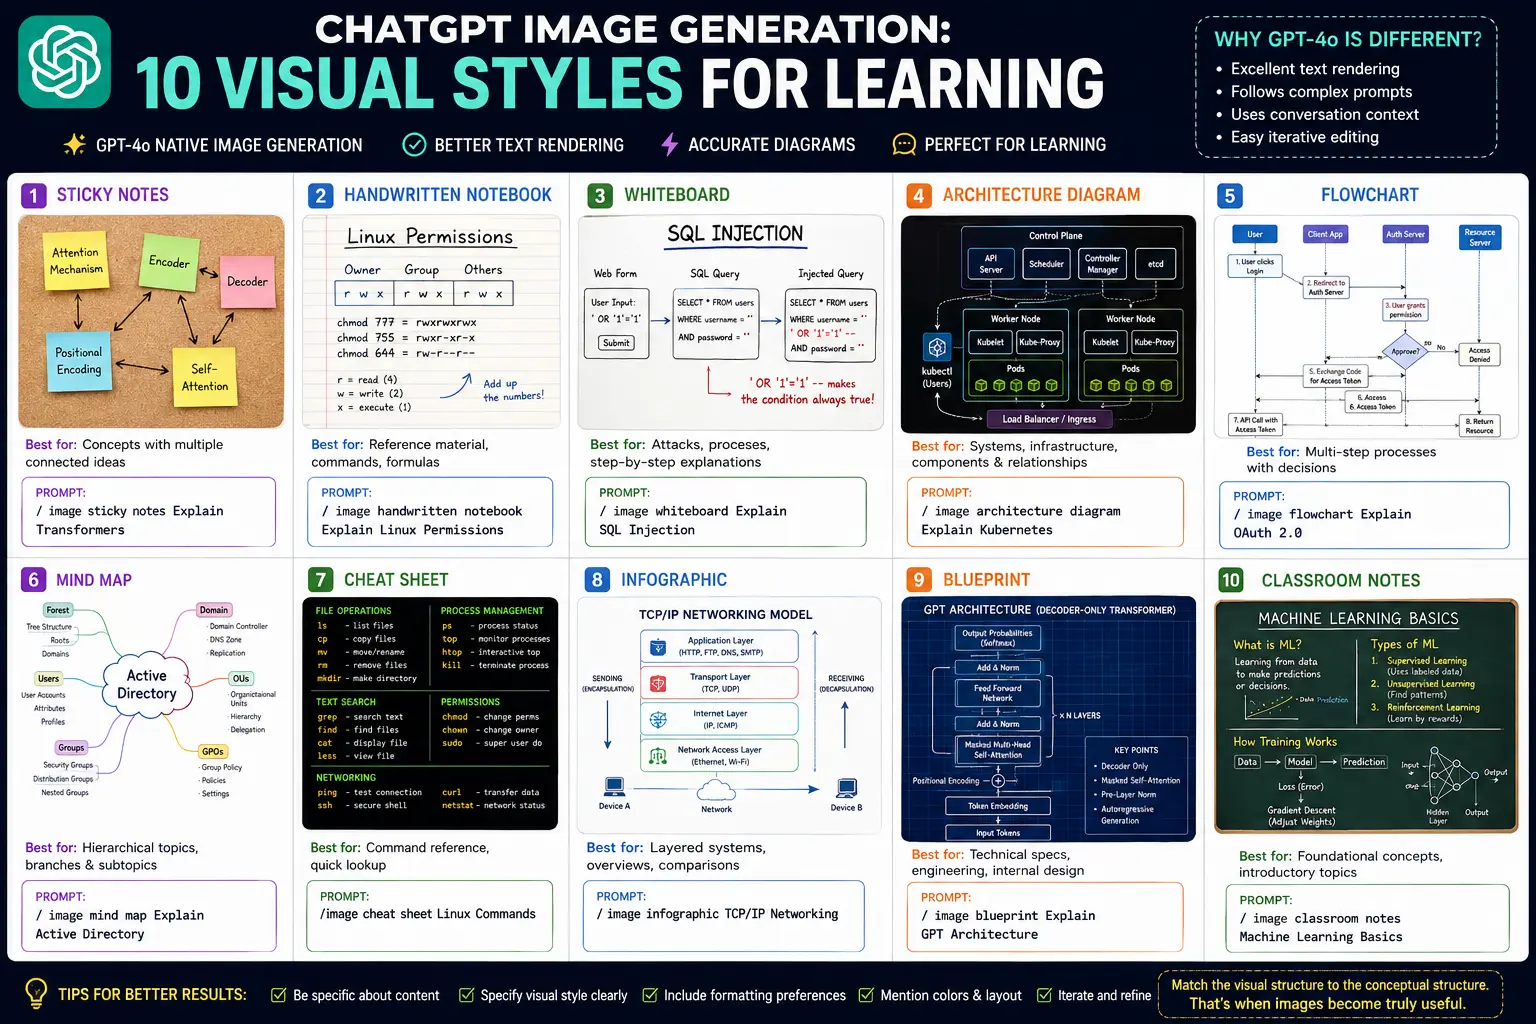
ChatGPT Image Generation: 10 Visual Styles for Learning (With Exact Prompts)
ChatGPT can now generate images directly inside the chat window. And the thing most people don’t know is that it’s genuinely good at educational visuals, not just Ghibli portraits.
Since OpenAI rolled out native GPT-4o image generation on March 25, 2025, over 130 million users have generated more than 700 million images (OpenAI COO Brad Lightcap, via TechCrunch). Most of that is art. But a quieter, more useful category is emerging: images that explain things.
Sticky notes. Whiteboards. Cheat sheets. Mind maps. Blueprints. These aren’t artistic styles. They’re formats. And GPT-4o handles them well.
Here are 10 visual styles, what each one is good for, and the exact prompts that generate them.
What makes GPT-4o different for educational images?
Previous AI image models struggled with one thing above everything else: readable text inside images. Diagrams with labels. Flowcharts with step descriptions. Cheat sheets with actual commands on them.
GPT-4o generates images using the same model that understands your text, leading to dramatically better prompt adherence, text rendering, and conversational editing. That’s the real unlock for learning visuals. A whiteboard explanation is useless if the text on it is garbled. GPT-4o gets the text right.
GPT-4o image generation excels at accurately rendering text, precisely following prompts, and leveraging its inherent knowledge base and chat context. For educational content, that knowledge base matters. Ask it to create a flowchart of OAuth 2.0 and it already knows what OAuth 2.0 is. You don’t have to explain the concept and the format simultaneously.
The 10 visual styles and exactly how to prompt them
1. Sticky notes: for concepts with multiple connected ideas
Sticky notes work for topics where several ideas relate to each other but none of them is the “main” one. Transformers architecture. Design thinking phases. Agile ceremonies.
The visual structure (scattered notes with arrows connecting them) mimics the non-linear way these concepts actually relate.
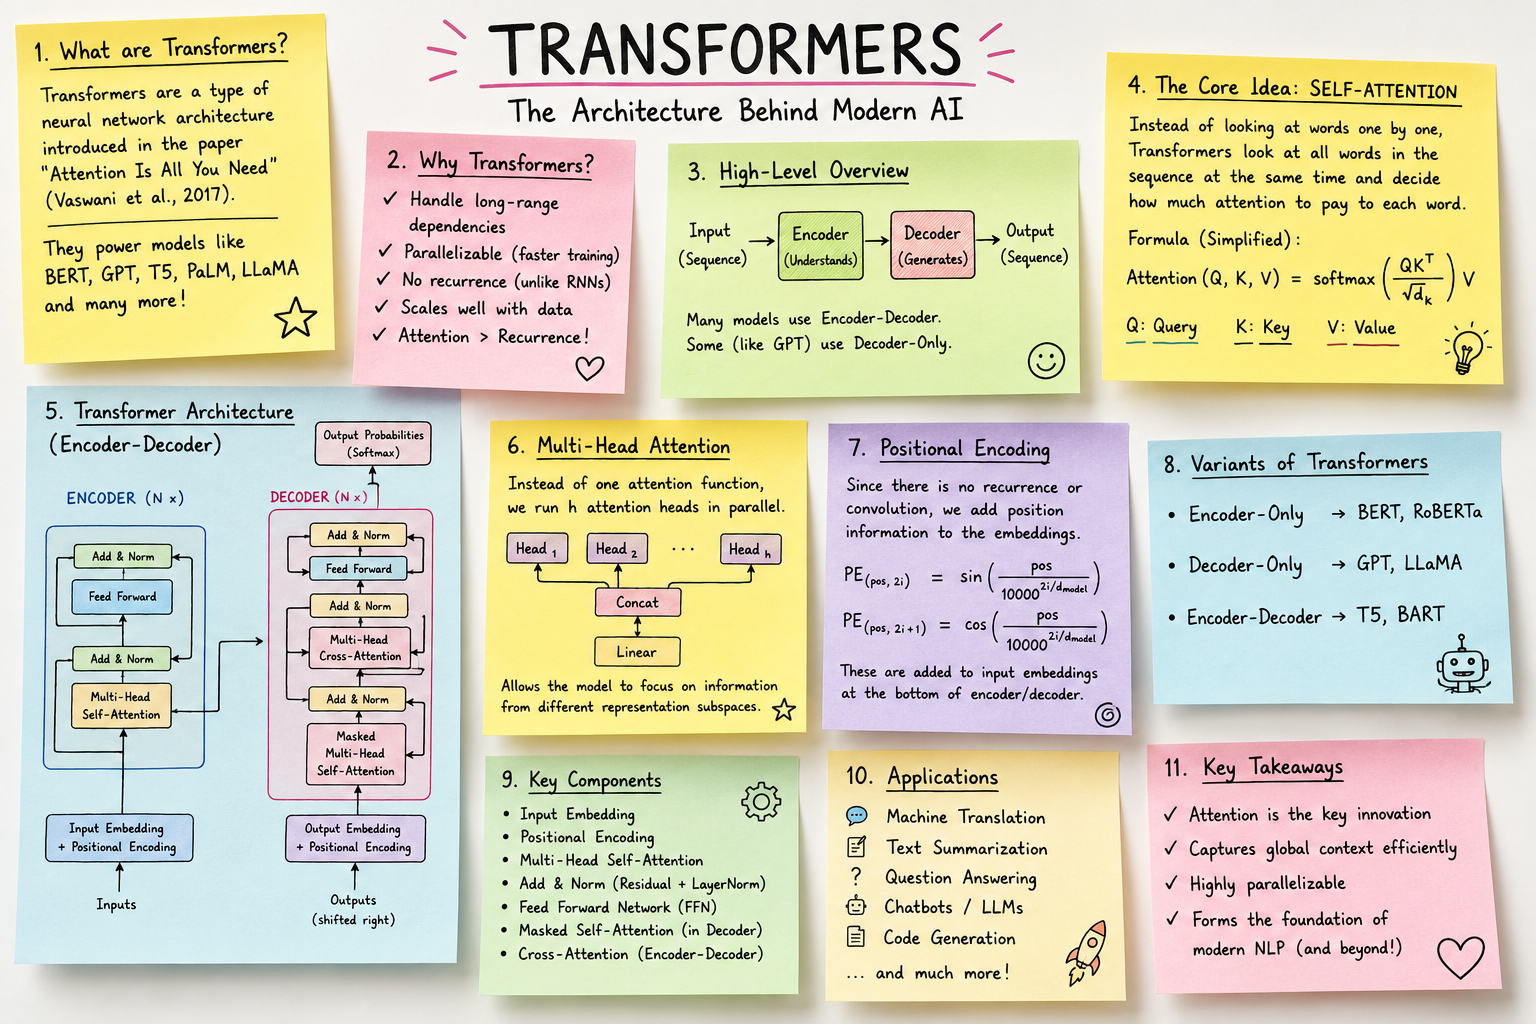
Prompt that created this:
1
/image sticky notes Explain Transformers
Full prompt version for better results:
1
2
3
4
5
Create an educational image in a sticky notes style explaining how the Transformer
architecture works. Use colorful sticky notes on a cork board. Each note covers one
concept: attention mechanism, encoder, decoder, positional encoding, and self-attention.
Connect related notes with arrows. Include clear, readable text on each note.
Clean background, vibrant colors.
2. Handwritten notebook: for reference material you’ll return to
Handwritten notebooks suit topics with rules, formulas, or lookup tables. Linux permissions. CSS selectors. Git commands. The handwritten format signals “this is worth writing down,” which is the right mental register for foundational reference material.
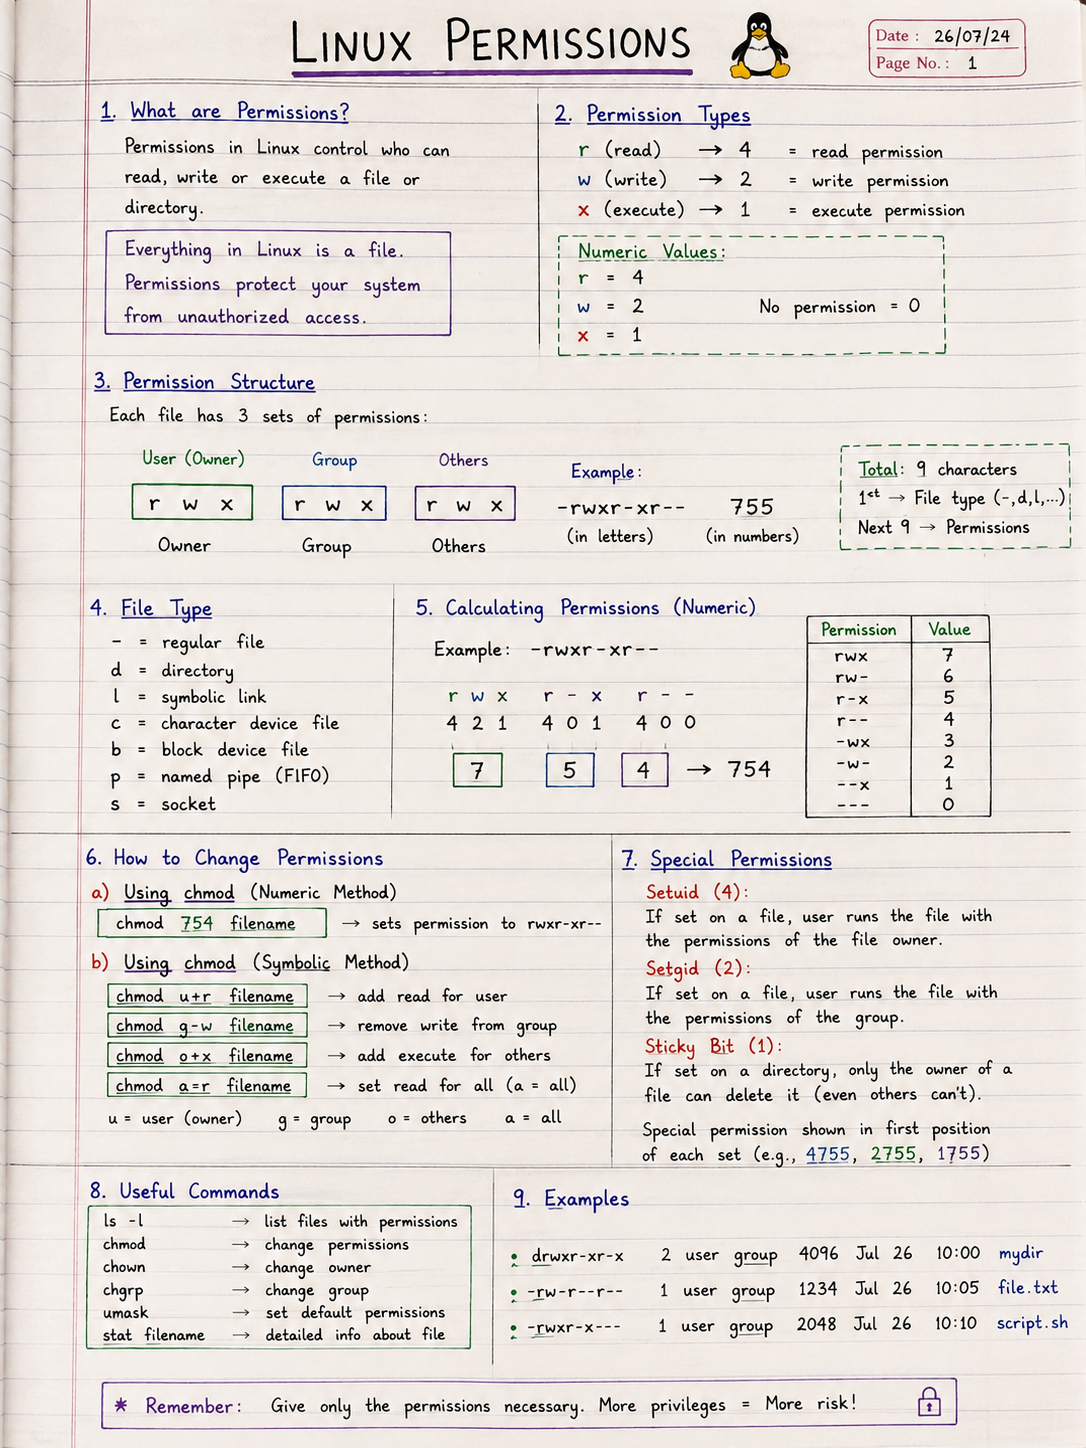
Prompt that created this:
1
/image handwritten notebook Explain Linux Permissions
Full prompt version:
1
2
3
4
5
Create an educational image that looks like a handwritten notebook page explaining
Linux file permissions. Include the rwx grid (owner, group, others), the chmod
number system (777, 755, 644), and examples of each. Use lined paper, blue ink,
small diagrams, and slightly messy but readable handwriting. Add margin notes
and underlined headings.
3. Whiteboard: for attacks, processes, and live demonstrations
Whiteboards work for anything you’d diagram live in front of a class. SQL injection, network attacks, API request flows. The format communicates “let me show you how this works” rather than “here’s what this is.”
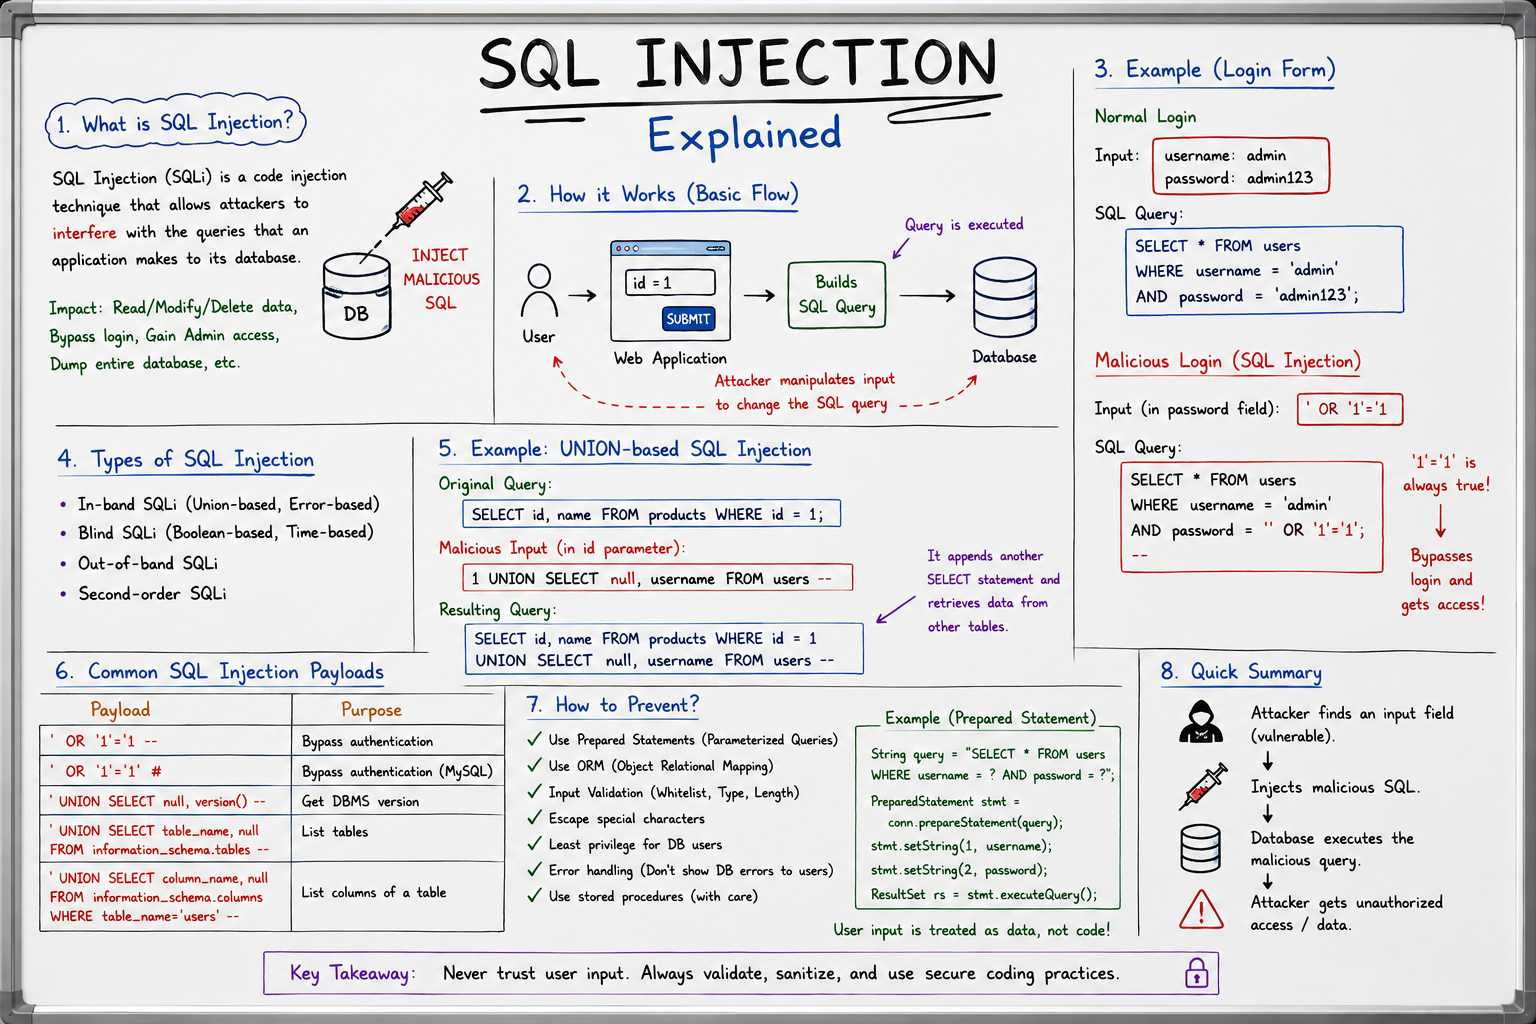
Prompt that created this:
1
/image whiteboard Explain SQL Injection
Full prompt version:
1
2
3
4
5
Create an educational whiteboard diagram explaining SQL injection. Show a web form
on the left, the SQL query it builds in the middle, and the injected payload on
the right. Use whiteboard marker style, blue and red markers, clear labels, and
arrows showing where the exploit enters the query. Include the classic
' OR '1'='1 example. Slightly rough hand-drawn style, white background.
4. Architecture diagram: for systems with components and relationships
Architecture diagrams are non-negotiable for distributed systems. Kubernetes. Microservices. Cloud infrastructure. These topics have components that need to be placed spatially relative to each other, with labeled connections.
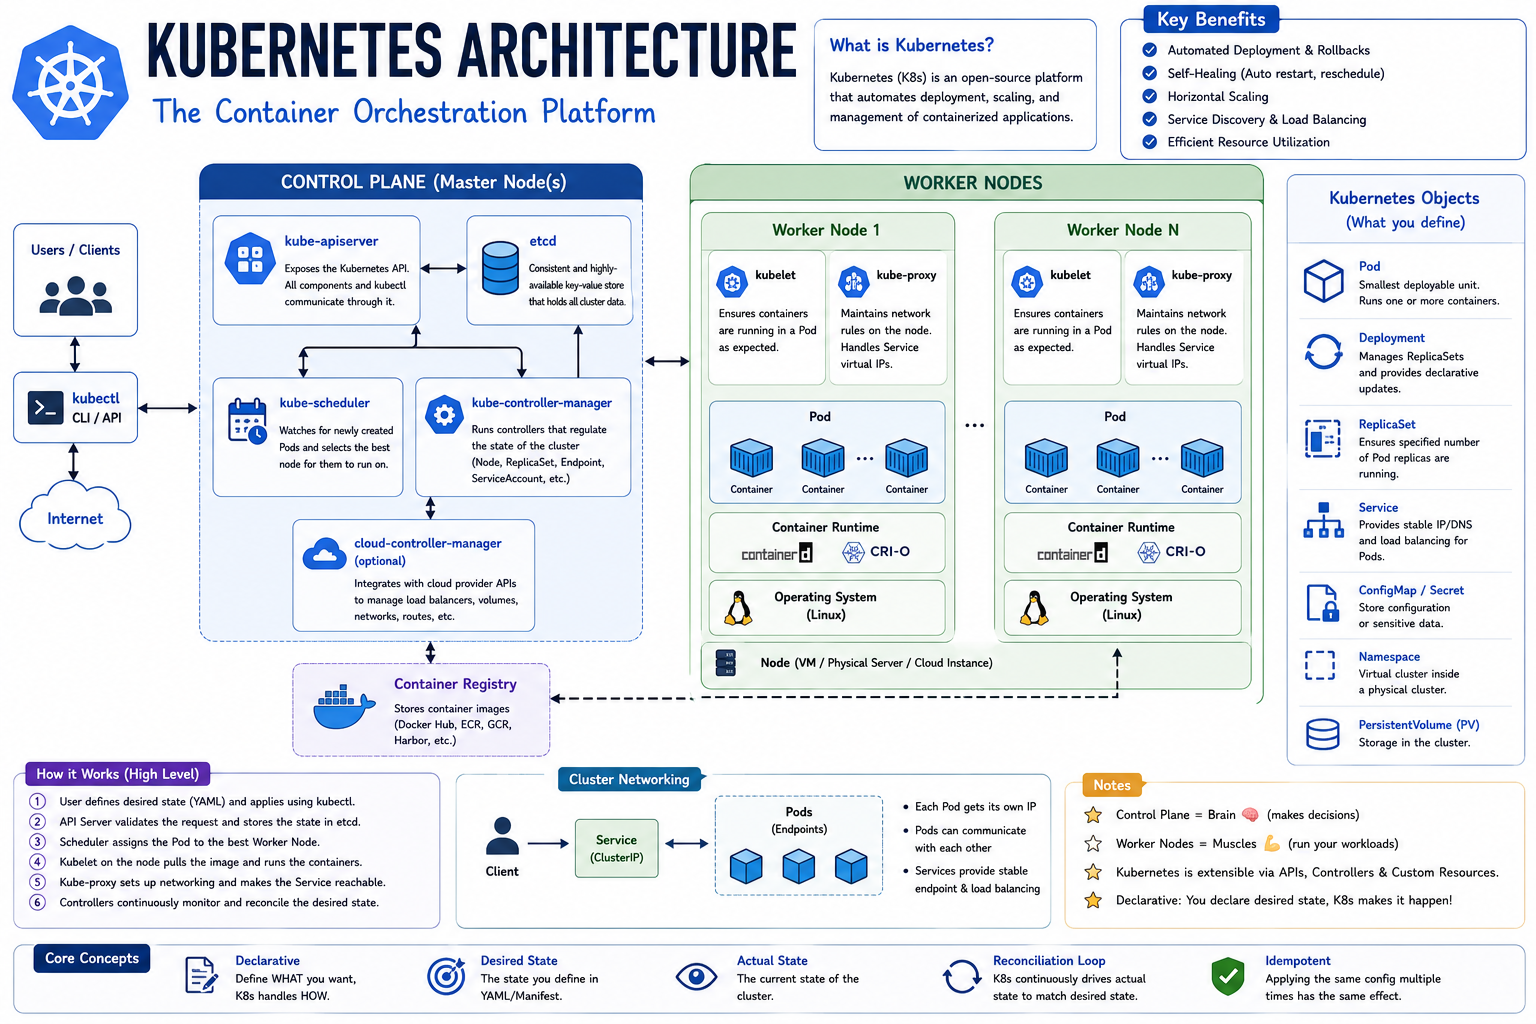
Prompt that created this:
1
/image architecture diagram Explain Kubernetes
Full prompt version:
1
2
3
4
5
Create a clean technical architecture diagram of Kubernetes. Show the Control Plane
(API Server, Scheduler, etcd, Controller Manager) at the top, Worker Nodes below
(with Pods, Kubelet, Kube-Proxy), and a Load Balancer at the entry point.
Use a dark background with colored component boxes, white labels, and clear
directional arrows. Clean, professional style. No decorative elements.
5. Flowchart: for multi-step processes with decisions
Flowcharts belong to anything with a sequence: OAuth 2.0, API authentication, CI/CD pipelines, user signup flows. If there’s a “yes/no” decision or a loop in the process, a flowchart is the right tool.
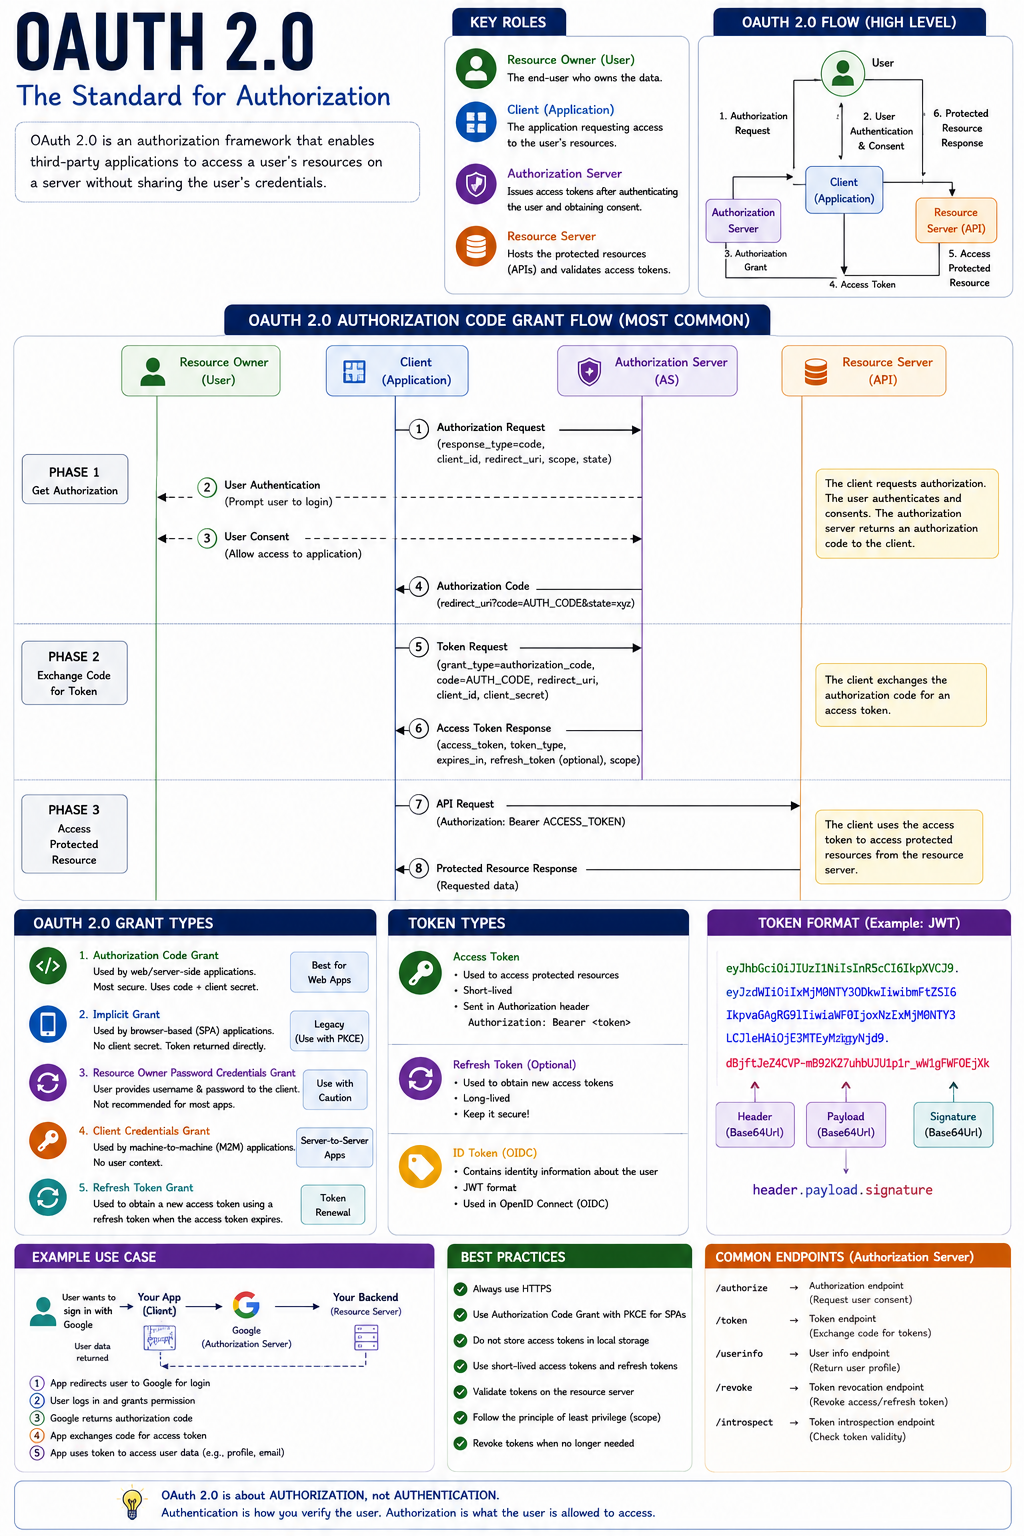
Prompt that created this:
1
/image flowchart Explain OAuth 2.0
Full prompt version:
1
2
3
4
5
6
Create a detailed flowchart explaining the OAuth 2.0 authorization code flow.
Show 4 actors: User, Client App, Authorization Server, Resource Server.
Include steps: user clicks login, redirected to auth server, user grants permission,
auth code returned, code exchanged for token, API call made with token.
Use diamond shapes for decisions, rectangles for steps.
Clean white background, color-coded by actor.
6. Mind map: for hierarchical structures with branches
Mind maps fit topics that have a clear center and branches that keep splitting. Active Directory. Network OSI model. Python data structures. The format works when the hierarchy is the concept.
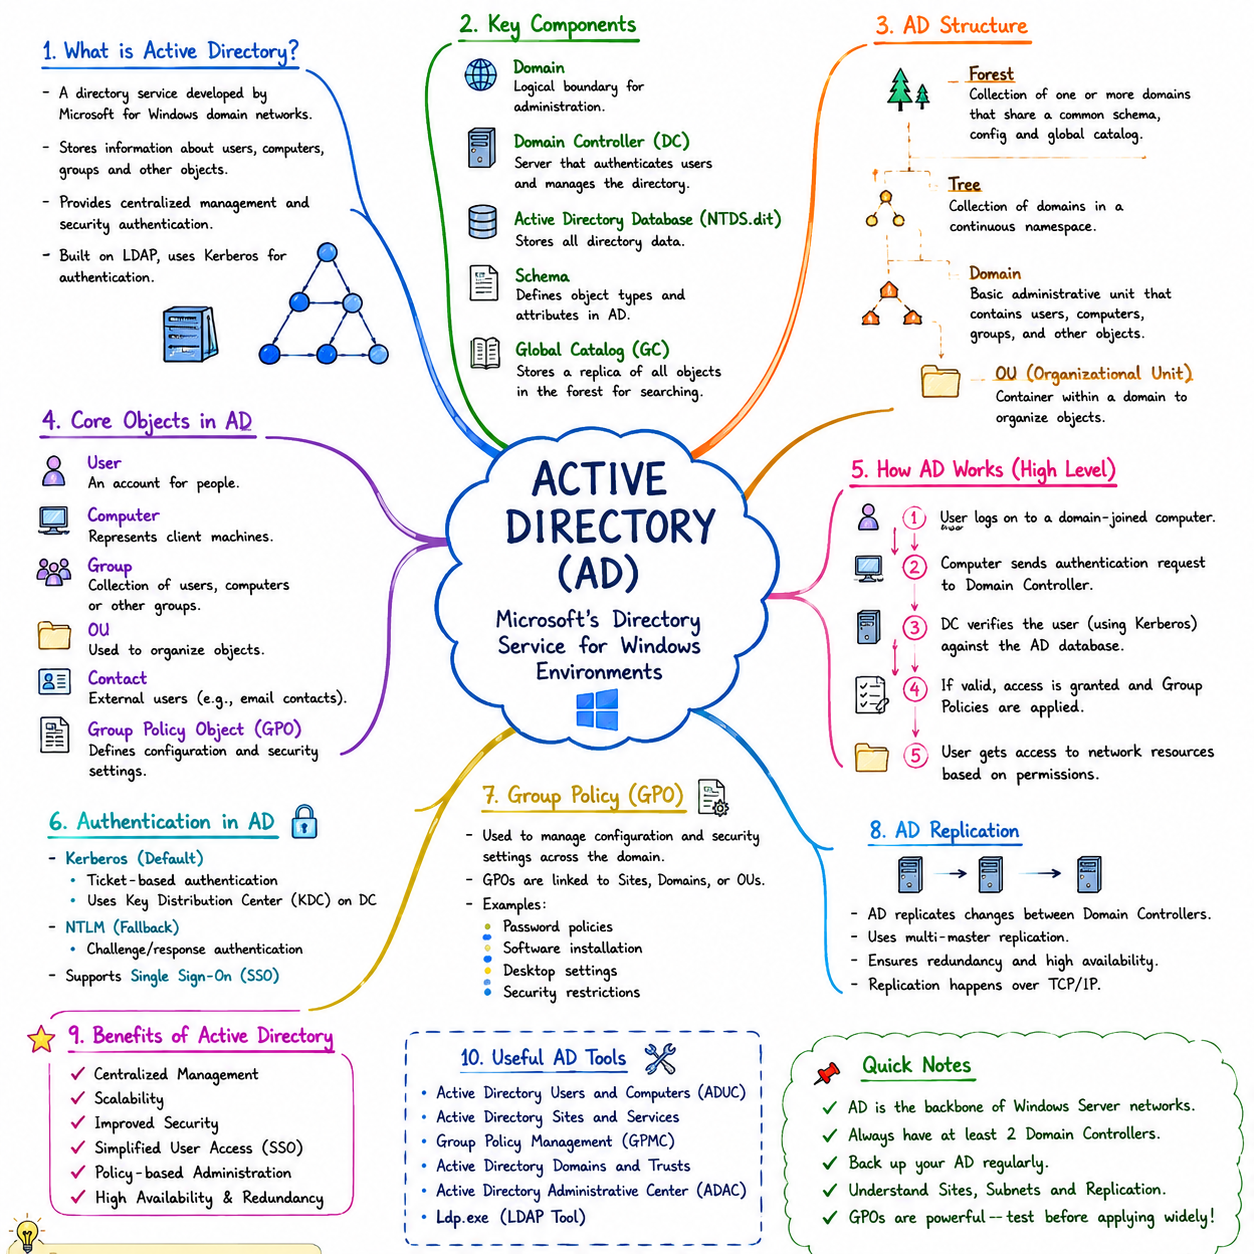
Prompt that created this:
1
/image mind map Explain Active Directory
Full prompt version:
1
2
3
4
5
Create a detailed mind map of Active Directory. Central node: "Active Directory."
Main branches: Forest, Domain, Organizational Units (OUs), Users, Groups,
Group Policy Objects (GPOs), Trust Relationships. Each main branch should
have 2-3 sub-branches with examples. Use a clean white background,
color-coded branches, and readable labels. Professional, not decorative.
7. Cheat sheet: for commands and syntax you look up repeatedly
Cheat sheets are reference cards. Linux commands, SQL syntax, Docker commands, Git shortcuts. The goal is information density without sacrificing readability. Nobody reads a cheat sheet. They scan it.
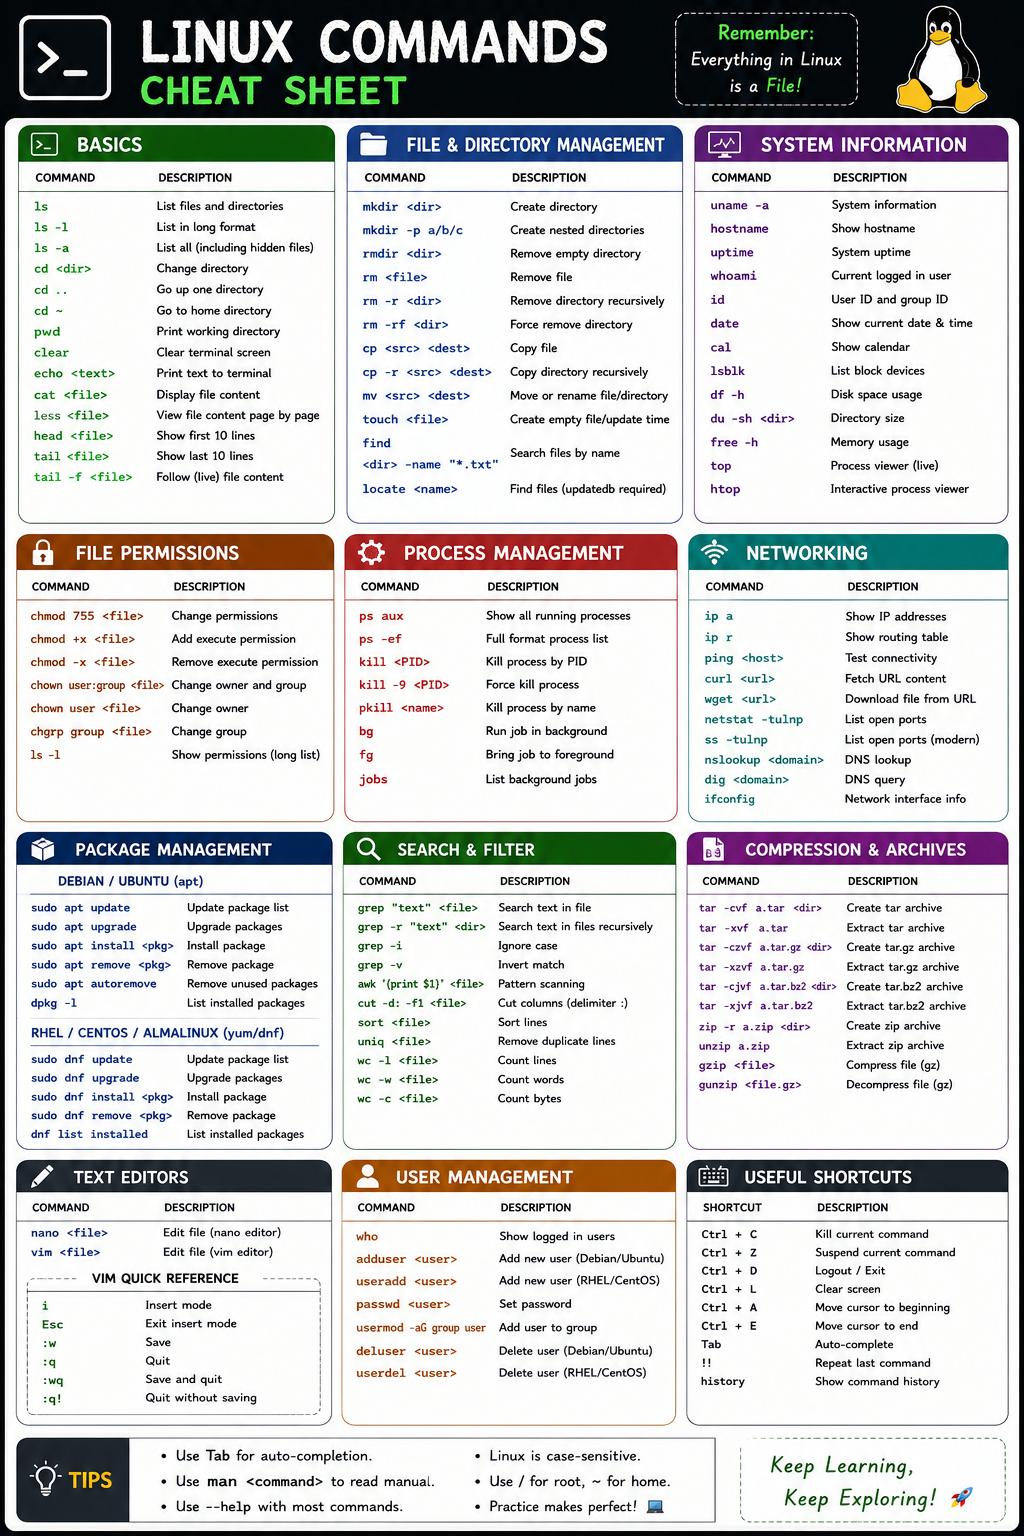
Prompt that created this:
1
/image cheat sheet Linux Commands
Full prompt version:
1
2
3
4
5
6
Create a visual cheat sheet for essential Linux commands. Organize into categories:
File Operations (ls, cp, mv, rm, mkdir), Text Search (grep, find, cat, less),
Process Management (ps, kill, top, htop), Permissions (chmod, chown, sudo),
Networking (ssh, curl, ping, netstat). Use a dark terminal-style background,
monospace font for commands, colored category headers.
Compact layout, maximum information per square inch.
8. Infographic: for layered systems with multiple components
Infographics suit topics where you need to show all parts at once, with relationships between layers. TCP/IP. The HTTP request lifecycle. How DNS resolution works. The goal is a bird’s-eye view that makes the whole system scannable in one look.
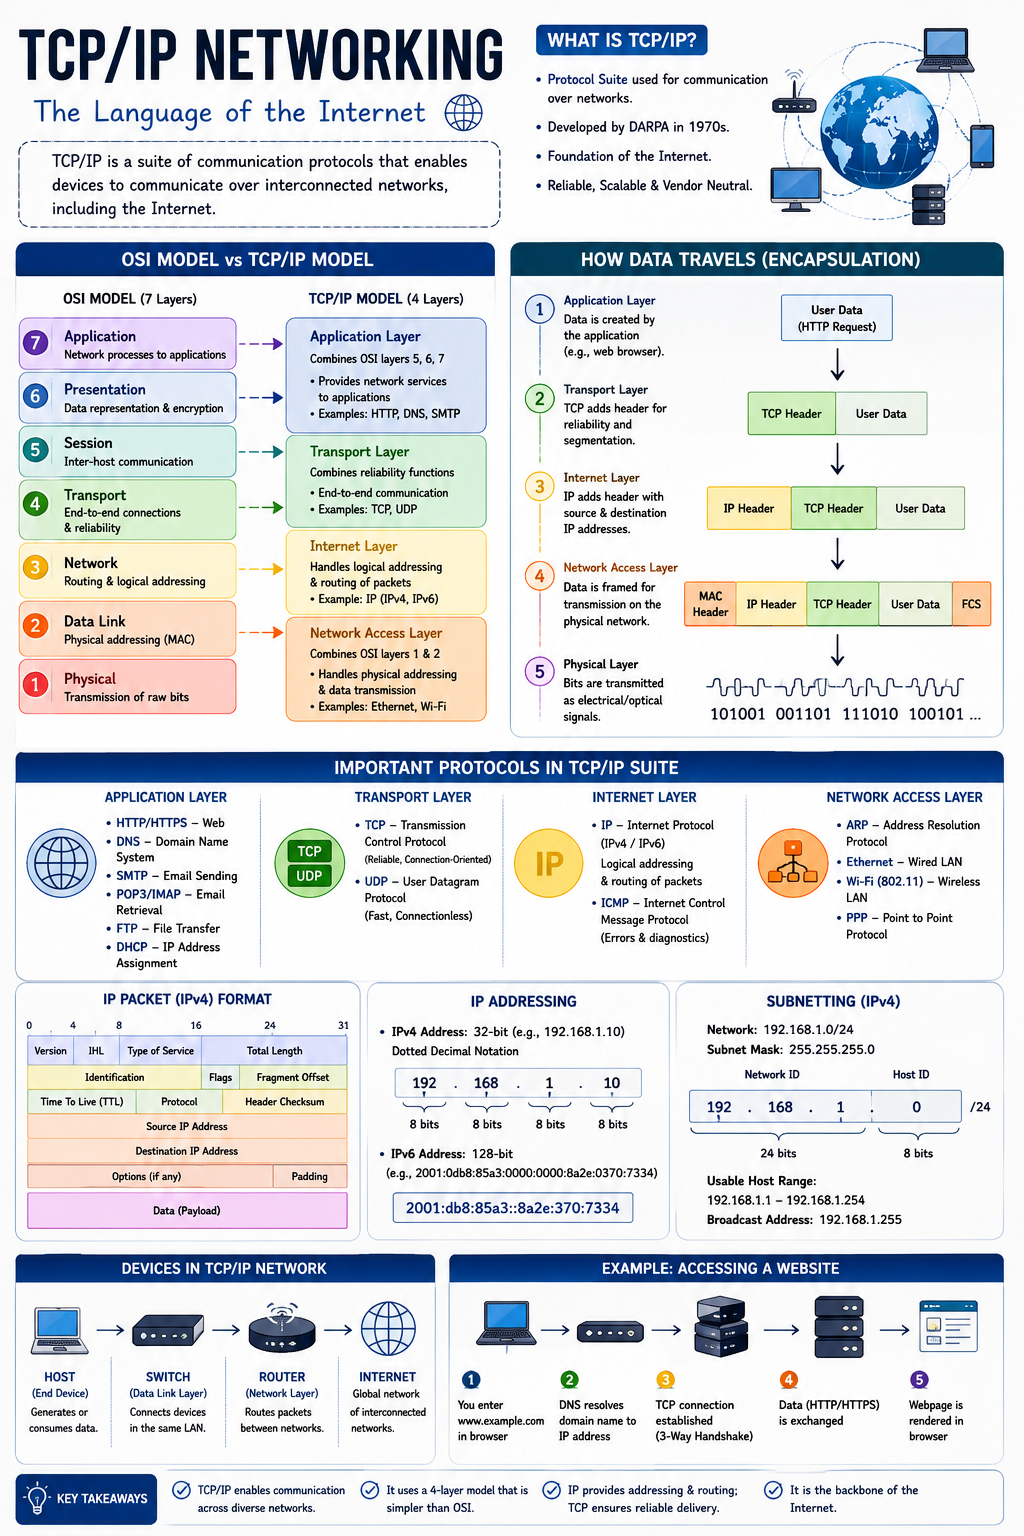
Prompt that created this:
1
/image infographic TCP/IP Networking
Full prompt version:
1
2
3
4
5
6
Create a professional infographic explaining TCP/IP networking. Show the 4-layer
model (Application, Transport, Internet, Network Access) as horizontal bands.
Include example protocols in each layer (HTTP/FTP in Application, TCP/UDP in Transport,
IP in Internet, Ethernet in Network Access). Show a data packet moving down the
layers on one side and up on the other. Clean, modern design with icons and
short labels. Light background.
9. Blueprint: for engineering specifications and internal architecture
Blueprints communicate precision and scale. They’re the right format for GPT architecture, database schema, API design, or any engineering spec that needs to convey “this was designed carefully.” The blueprint aesthetic signals technical depth.
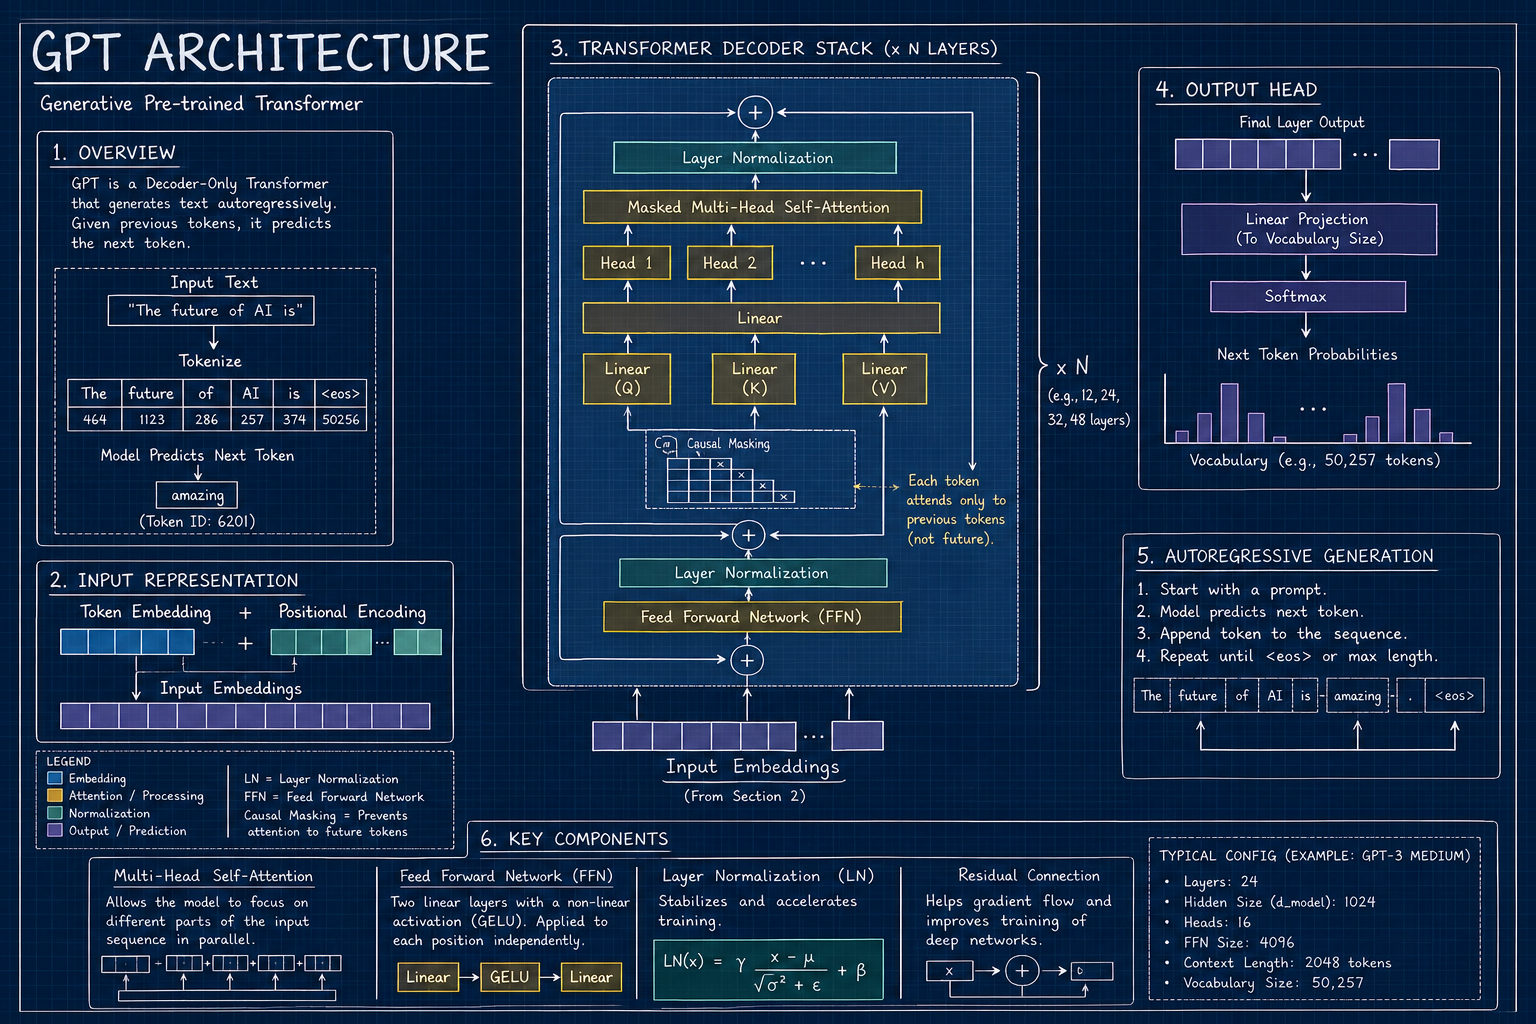
Prompt that created this:
1
/image blueprint Explain GPT Architecture
Full prompt version:
1
2
3
4
5
6
7
Create a technical blueprint diagram of GPT (Generative Pre-trained Transformer)
architecture. Show the decoder-only Transformer stack with components:
Token Embedding, Positional Encoding, Multi-Head Attention layers,
Feed-Forward layers, Layer Normalization, and Output Softmax.
Use a classic blueprint aesthetic: dark blue background, white/cyan lines and labels,
grid overlay. Include parameter counts and layer depth annotations.
Clean, technical, precise.
10. Classroom notes: for foundational concepts being taught from scratch
Classroom notes work for anything introductory. Machine learning basics. How the internet works. What a database is. The format signals “we’re starting from the beginning.” It’s inviting rather than intimidating, which is the right register for foundational content.
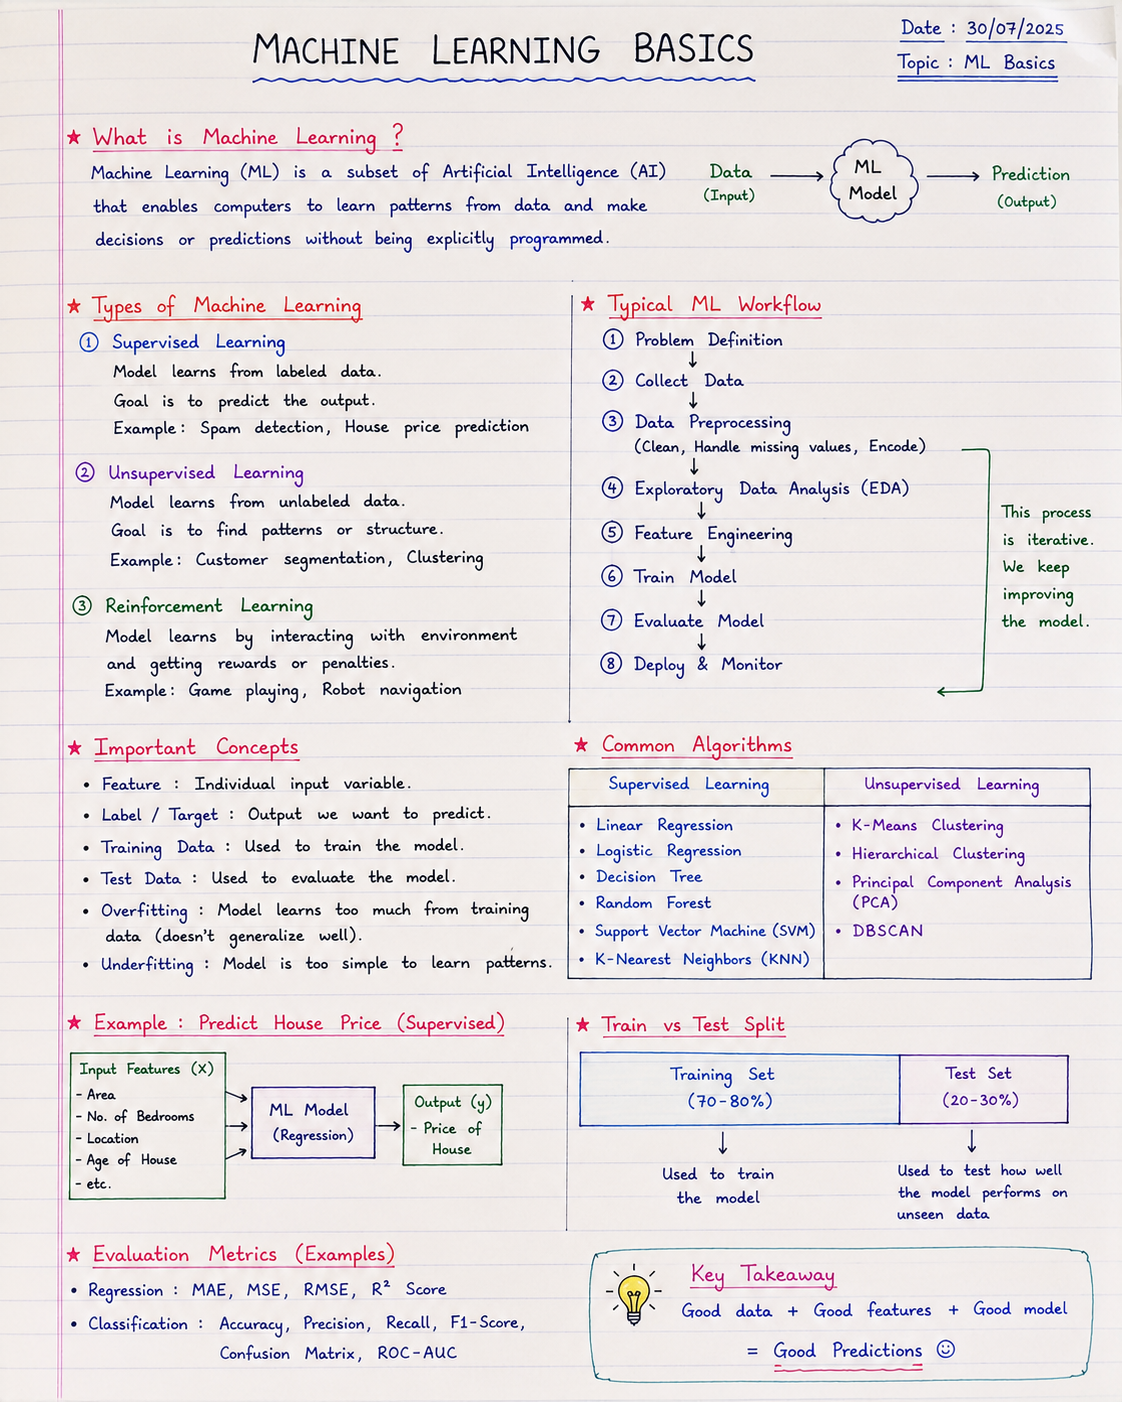
Prompt that created this:
1
/image classroom notes Machine Learning Basics
Full prompt version:
1
2
3
4
5
6
Create an image styled like classroom lecture notes on a blackboard or whiteboard
explaining machine learning basics. Cover: what ML is (learning from data),
the 3 types (supervised, unsupervised, reinforcement learning), how training works
(weights, loss function, gradient descent). Use chalk-on-blackboard aesthetic
with colored chalk for emphasis. Include small diagrams for each concept.
Slightly imperfect, human-looking handwriting.
How do you get better results from educational image prompts?
What’s the difference between a vague prompt and a useful one?
Vague: Create an image about machine learning.
Useful: Create a blackboard classroom notes image explaining the 3 types of machine learning (supervised, unsupervised, reinforcement) with a small diagram for each type. Use colored chalk on dark background.
The gap is specificity. GPT-4o responds to 4 things: subject, format, content details, and visual style. Give it all 4 and the output lands close to what you need.
Can you edit the image after it’s generated?
Yes. GPT-4o generates images inside the chat thread, which means you can iterate conversationally. “Make the text larger.” “Change the background to dark mode.” “Add a fifth step to the flowchart.” Each follow-up refines the same image in context.
Unlike earlier DALL-E integrations that opened a separate canvas, GPT-4o generates visuals inside the chat thread, drawing on the full conversational context. You can upload a photo, refine style directions, and iterate, all in a single prompt-and-reply loop.
Does it work for non-English topics?
Yes. GPT-4o generates educational images with text in multiple languages. If you’re creating learning content for Hindi, Spanish, or Arabic-speaking audiences, specify the language in your prompt: “All labels and text in Hindi.”
Which format should you use for your topic?
The format is part of the explanation. A flowchart of Active Directory hierarchy would confuse you. A mind map of an OAuth flow would do the same.
Pick based on the shape of the concept. If it’s a sequence: flowchart. If it’s a hierarchy: mind map. If it’s a system with components: architecture diagram. If it’s commands: cheat sheet. If it’s layers: infographic. If it’s foundational: classroom notes.
Match the visual structure to the conceptual structure. That’s when these images stop being decorative and start being uprompt
more prompts
``` /image infographic /image handwritten notes /image sticky notes /image whiteboard explanation /image mind map /image flowchart /image concept map /image cheat sheet /image flashcards /image blueprint /image architecture diagram /image timeline /image roadmap /image decision tree /image comparison table /image notebook page /image classroom notes /image textbook illustration /image poster /image presentation slide /image comic style /image pixel art /image isometric illustration /image 3D render /image cyberpunk /image minimal flat design /image glassmorphism /image neon style /image chalkboard notes /image terminal UI /image dashboard UI /image Figma mockup /image wireframe /image anime style /image watercolor /image oil painting /image pencil sketch /image realistic photo /image magazine cover /image LinkedIn carousel /image X (Twitter) infographic /image YouTube thumbnail ‘’’